The purpose of this assignment is to provide you with an opportunity to collect and plot single subject data. It is a learning activity and not a research study.
1. Select some observable behavior that you wish to plot where there can be a baseline and an intervention condition.
2.Select someone or something to observe.
3. Design a sampling plan and define the behavior you are observing. For example you may wish to observe a student for 30 minutes and record every minute whether the student is “on task” (in this case the student would have an “on task” frequency score from 0-30). This represents one data point. You will need to define what “on task” behavior is. Another example might involve observing how many times someone does something in a 5-minute interval. Each 5-minute interval would represent one data point. You would count the number of times the behavior occurred during each five-minute interval.
4. Collect data for at least 3 baseline data points (minimum for a pattern). Collect five additional data points after you implemented your treatment/condition.
5. Take a photo of the research setting.
6. Write a paragraph describing what you did and create a graph displaying your data.
The assignment will be graded as follows:
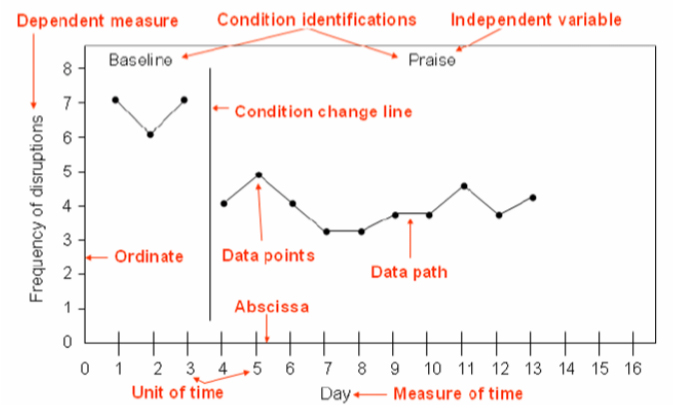
- 8 points for data points (1 point for each Data Point)
- 1 point for the frequency label (Dependent Measurement)
- 1 point for the time label (Unit of Time and Measure of Time)
- 1 point for the frame (Abscissa and Ordinate)
- 2 points for condition labels (Condition Identification)
- 1 point for condition change line
- 2 points for the paragraph describing the data collection (1 point for the description of the data collection plan and 1 point for the definition of the behavior
- 1 point for a photo of the research setting